
Create Dynamic Data Visualizations in Google Slides
Elevate your presentations with easy-to-use, up-to-date charts for Google Slides, powered by Plus AI.
69.6k
Powerful Features
Discover what makes Plus AI Google Analytics Reports stand out from the competition
Seamless Integration
Effortlessly incorporate data visualizations directly into your Google Slides.
Real-Time Updates
Keep your charts up-to-date with the latest data changes, without additional effort.
User-Friendly Interface
Create stunning visuals with an intuitive design, perfect for any skill level.
Real-World Applications
See how Plus AI Google Analytics Reports can transform your workflow and boost productivity
Business Presentations
Use impactful charts to convey complex business data clearly to stakeholders.
Educational Materials
Enhance learning experiences with engaging and informative visual aids.
Research Reports
Present research findings effectively with dynamic and clear data representations.
Final Thoughts
Utilize the power of Plus AI to transform your Google Slides into dynamic, visually appealing presentations. Stay connected with real-time data for impactful storytelling.
Share & Embed
Help others discover Plus AI Google Analytics Reports by embedding it on your website
Dark Theme
Perfect for dark websites

Light Theme
Ideal for light websites

Plus AI Google Analytics Reports Alternatives

AI-driven presentation software boosting enterprise productivity and compliance with robust security.
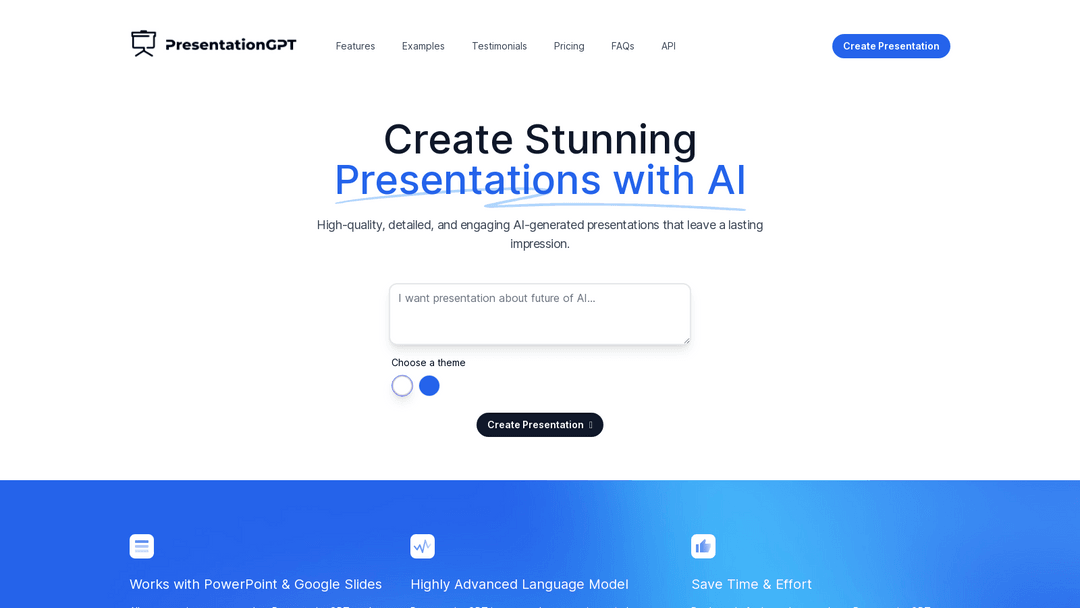
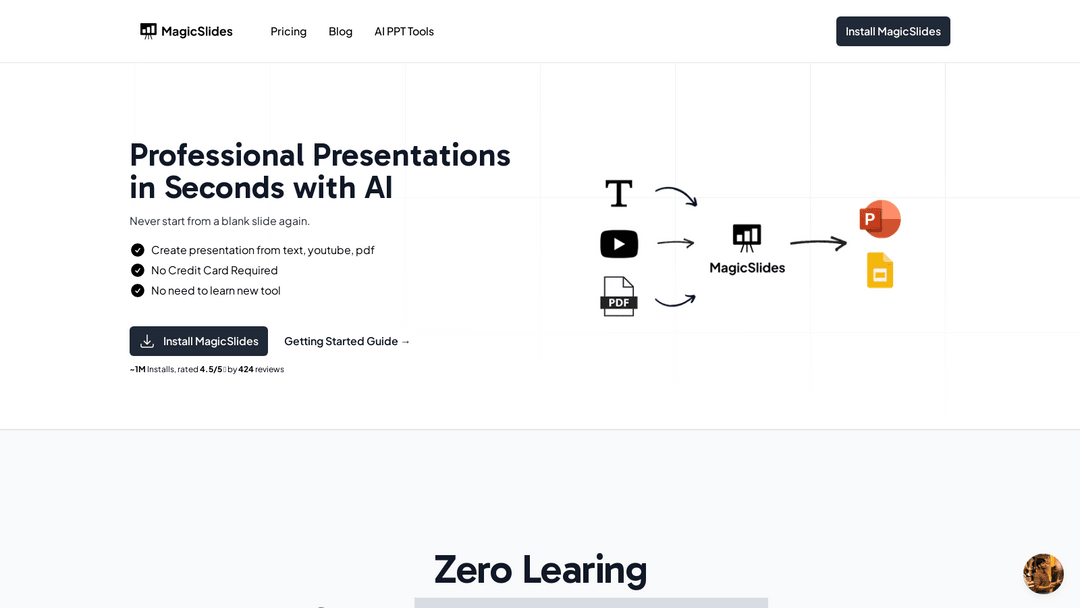
AI-powered tool streamlines impressive Google Slides creation and design.
AI-powered tool quickly creating professional presentations in popular formats.

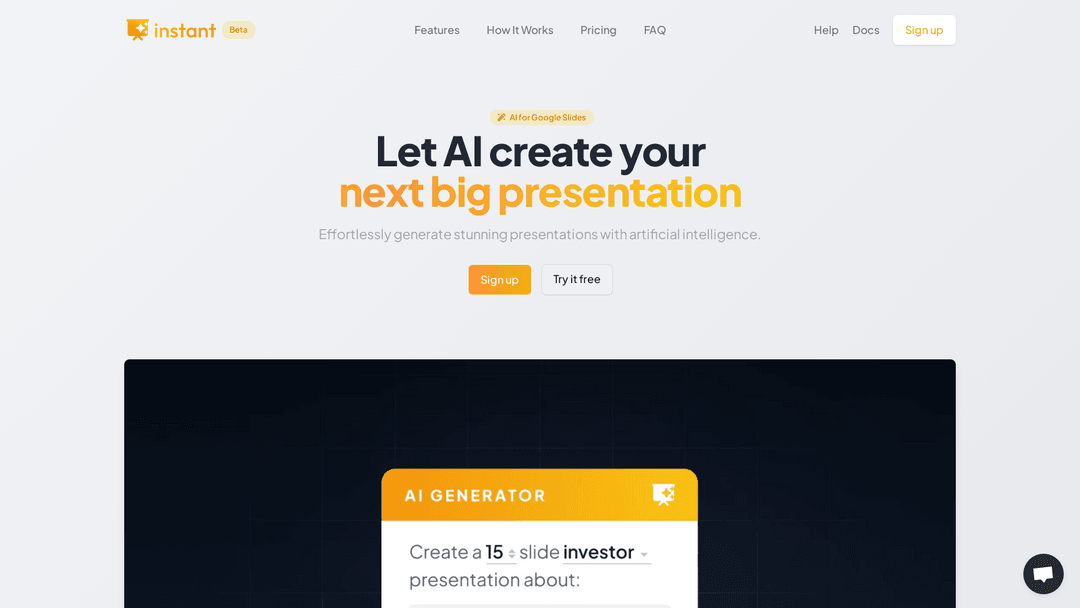
AI-powered tool for quick, engaging presentation creation and design assistance.

AI-driven presentation maker for rapid, professional, brand-aligned slide design.

Generates analytics, reports, presentations automatically; ideal for business and academia.

Provides easy marketing analytics reporting with interactive dashboards via Google Sheets.