Transform Text into Stunning Charts
Effortlessly convert your textual data into visually appealing charts with our intuitive tool. Experience data visualization like never before.
1.6m
Powerful Features
Discover what makes ChartGPT stand out from the competition
User-Friendly Interface
Navigate easily through a simple and intuitive interface designed for users of all skill levels.
Variety of Chart Types
Choose from a wide range of chart types to best represent your data, including pie, bar, and line charts.
Customizable Designs
Tailor the look and feel of your charts with customizable design options to match your aesthetic.
Seamless Data Import
Quickly import your text data from various sources to create charts without hassle.
Real-World Applications
See how ChartGPT can transform your workflow and boost productivity
Business Presentations
Enhance your business reports and presentations with clear and impactful visual data representation.
Educational Materials
Create educational charts and graphs that make learning more engaging and accessible for students.
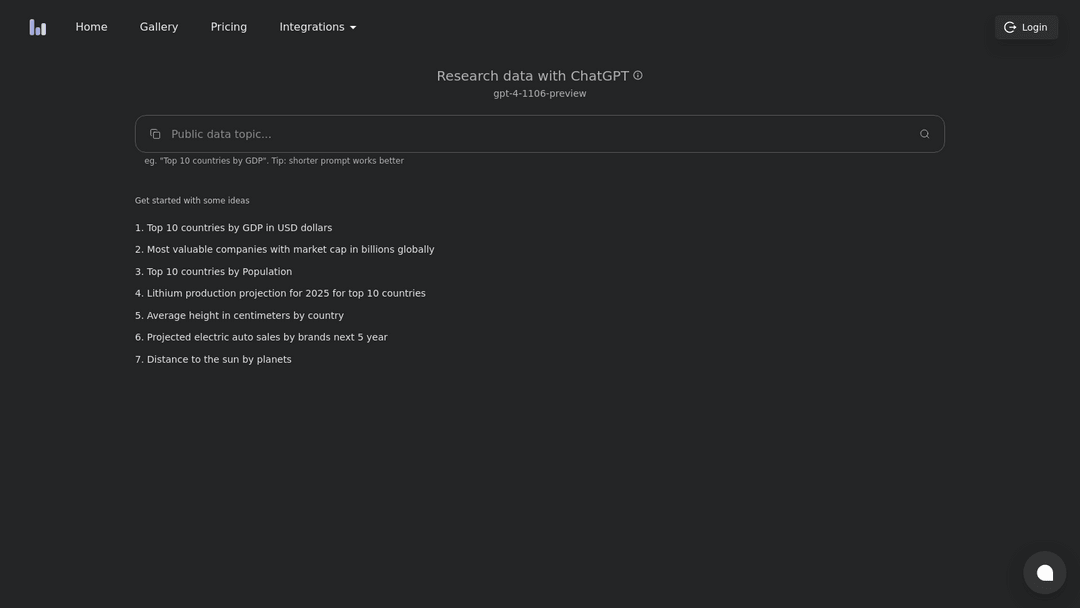
Research Analysis
Visualize complex research data in a digestible manner for academic papers and reports.
Final Thoughts
Our chart conversion tool is designed to simplify the process of turning raw text data into stunning visual charts, enhancing clarity and communication.
Share & Embed
Help others discover ChartGPT by embedding it on your website
Dark Theme
Perfect for dark websites

Light Theme
Ideal for light websites

ChartGPT Alternatives

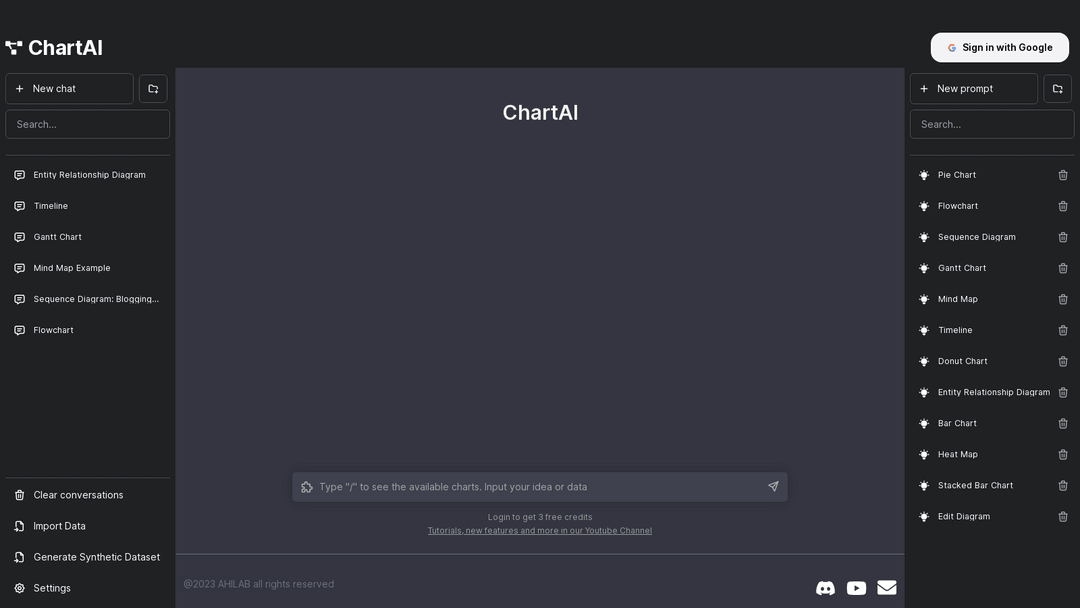

AI tool simplifies creating beautiful, insightful graphs from bar to flowcharts.
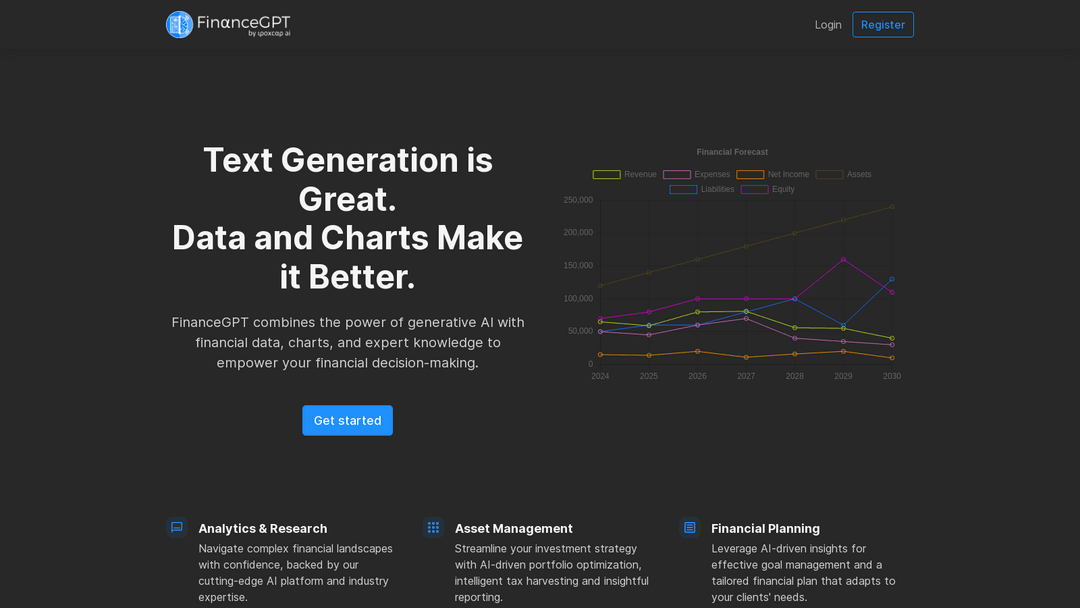
FinanceGPT offers AI-powered financial decision-making, analysis, forecasting and monitoring.