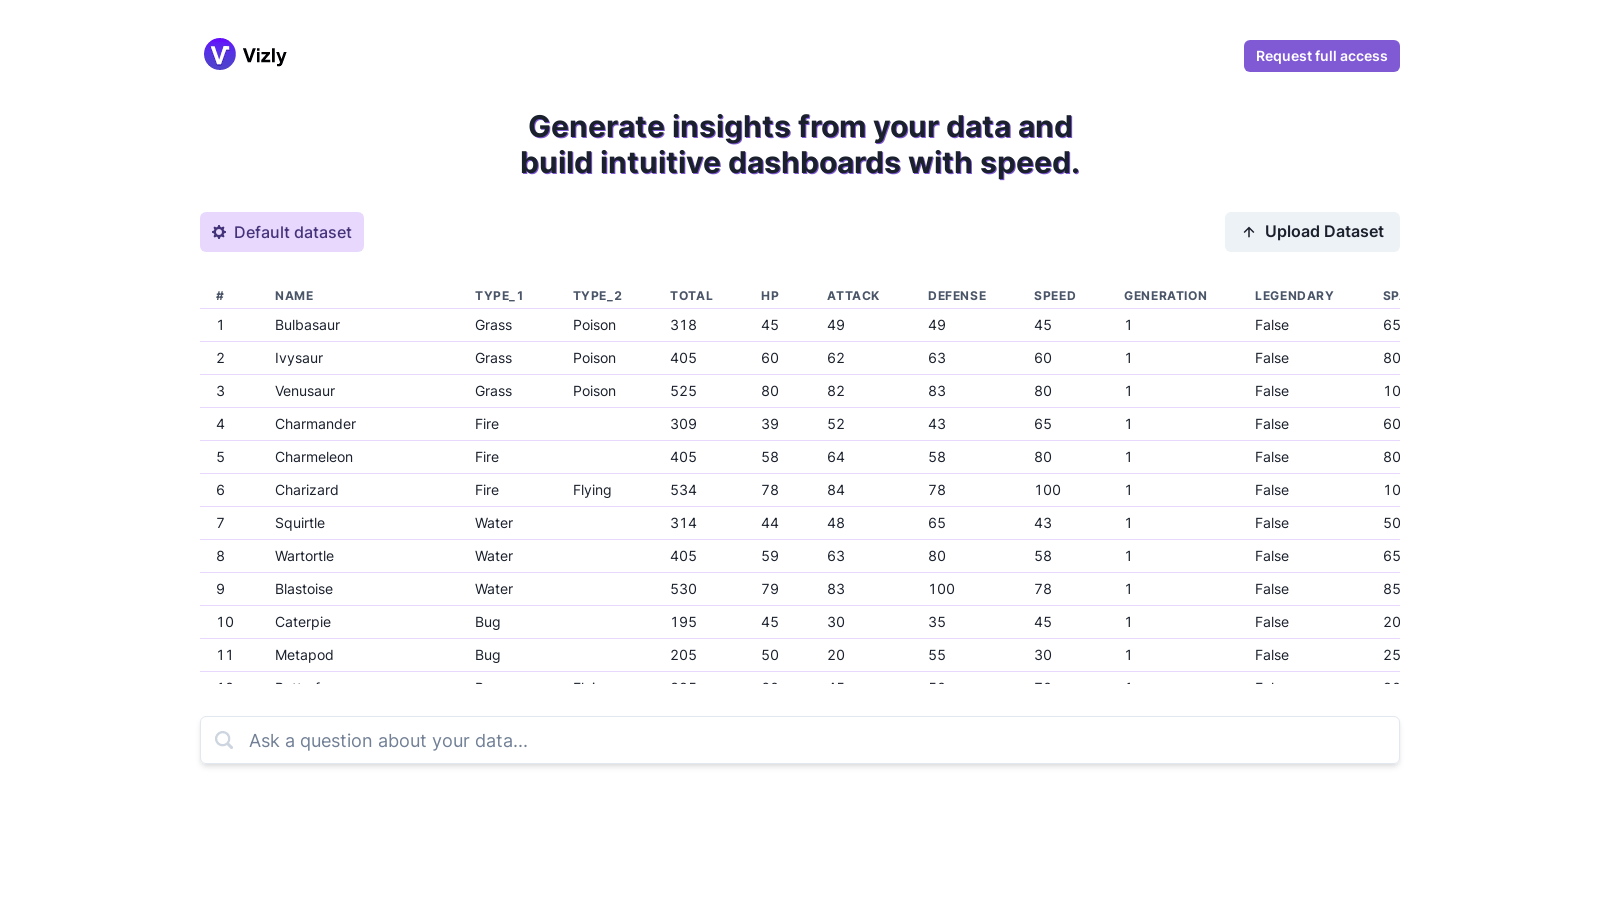
Automating Data Visualization with ChatGPT
Build insightful dashboards with high speed and accuracy using ChatGPT's automation services
| Semrush rank: | 41.0m |
| Location: | Tempe, United States of America |
| Tech Used: | Chakra UI ; Tailwind CSS, Node.js, React ; Emotion ; Next.js, Next.js, |
Edit this Page
Features
- Speedy Insights: ChatGPT's automation services give you insights from your data at lightning fast speed.
- Intuitive Dashboards: Build dashboards that are easy to understand, even for non-technical team members.
- Full Access: Request full access so you can get started building insightful dashboards right away.
Use Cases:
- Business Metrics Tracking: Track KPIs and other key business metrics to visually see how your business is performing.
- Sales Reporting: Use ChatGPT to build easy-to-understand sales reports for your sales team.
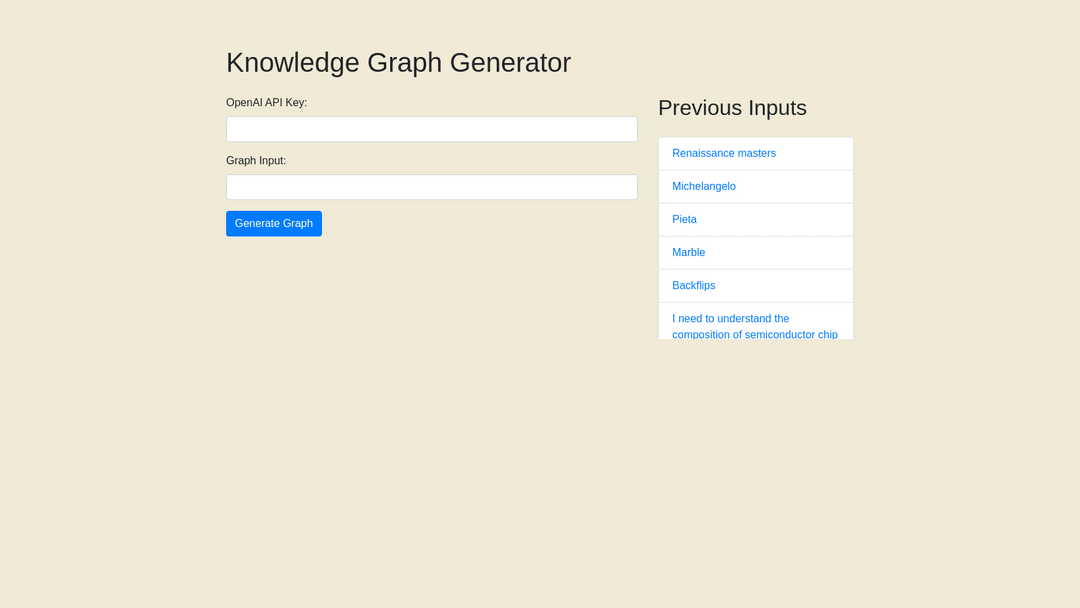
With ChatGPT, you can easily gain insights from your data and build beautiful and intuitive dashboards.


Vizly Alternatives:
Free
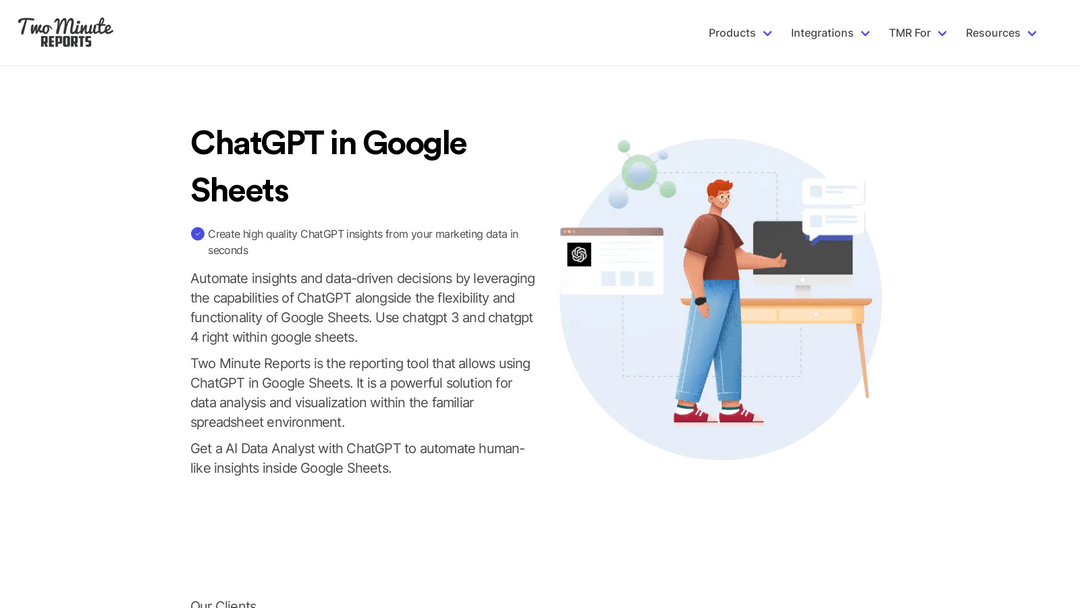
1. ChatGPT in Google Sheets
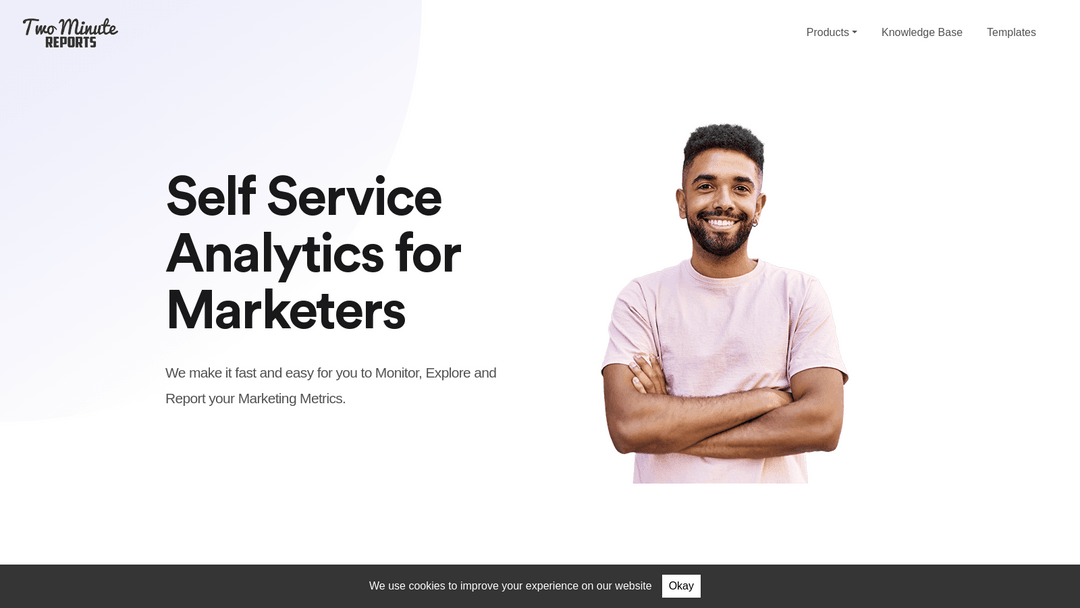
Provides easy marketing analytics reporting with interactive dashboards via Google Sheets.
analytics
Free
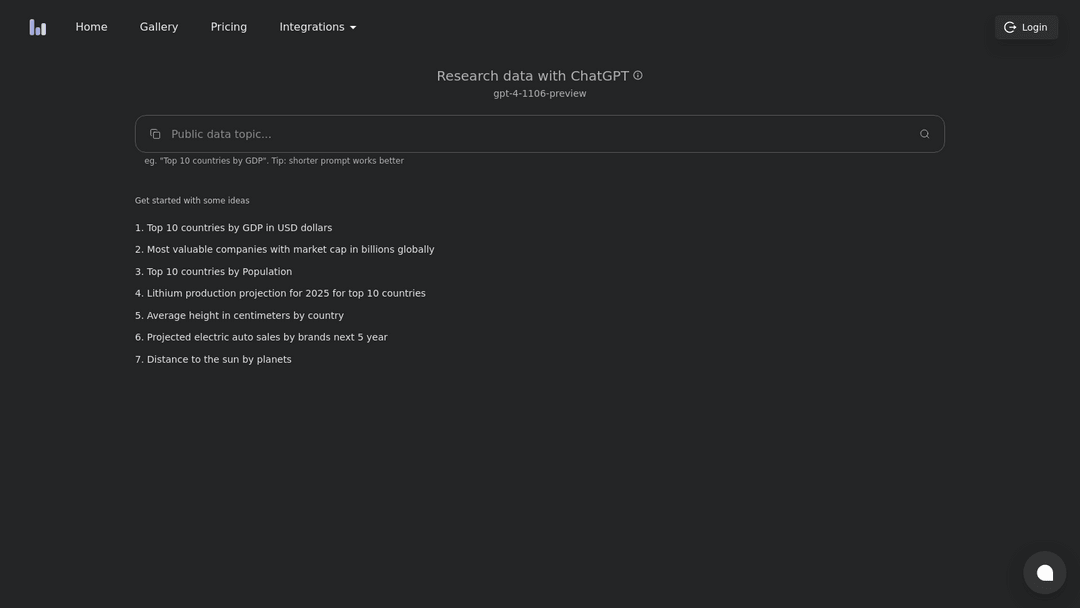
2. ChatGPT in Google Sheets 2018
Enhance Google Sheets with ChatGPT: Quick data analysis and report automation.
automation
Free + $15/mo
2
3. Columns 2020
Natural language-driven, fast data visualization and collaborative, secure storytelling tool.
data
Free
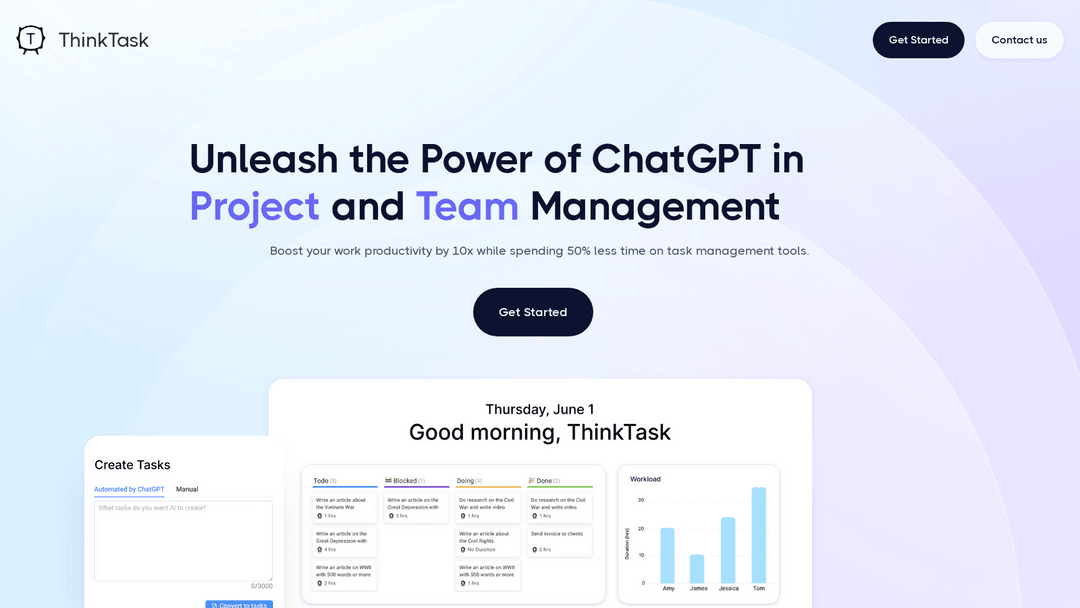
4. Thinktask 2023
Enhance productivity with AI-powered task automation and intelligent insights.
task management
Free
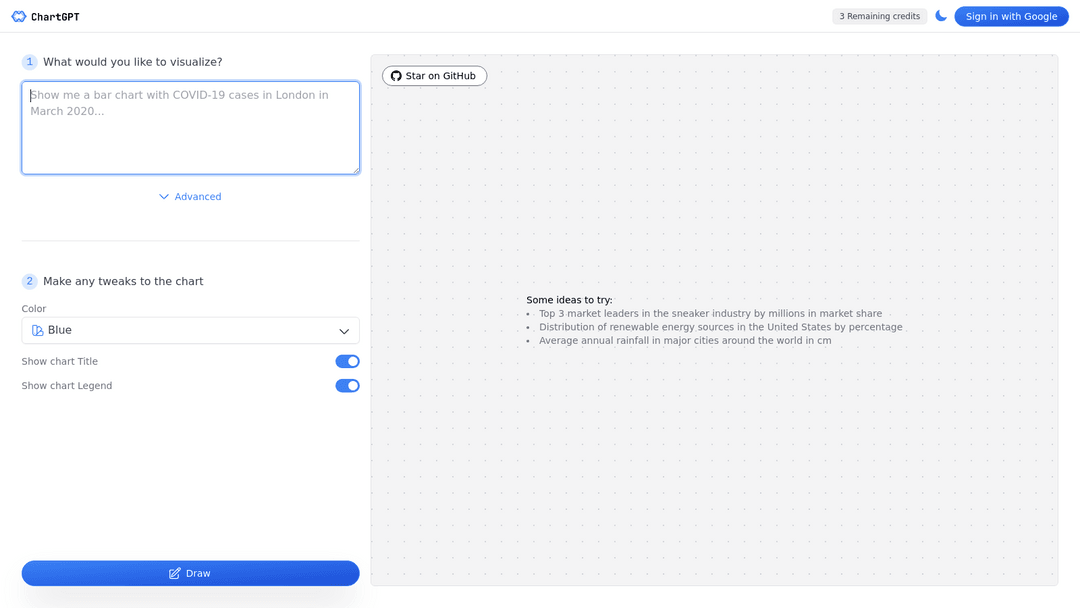
6. DataGPTd 2023
Instantly analyze and visualize data through intuitive, conversational browser-based interaction.
data
Free
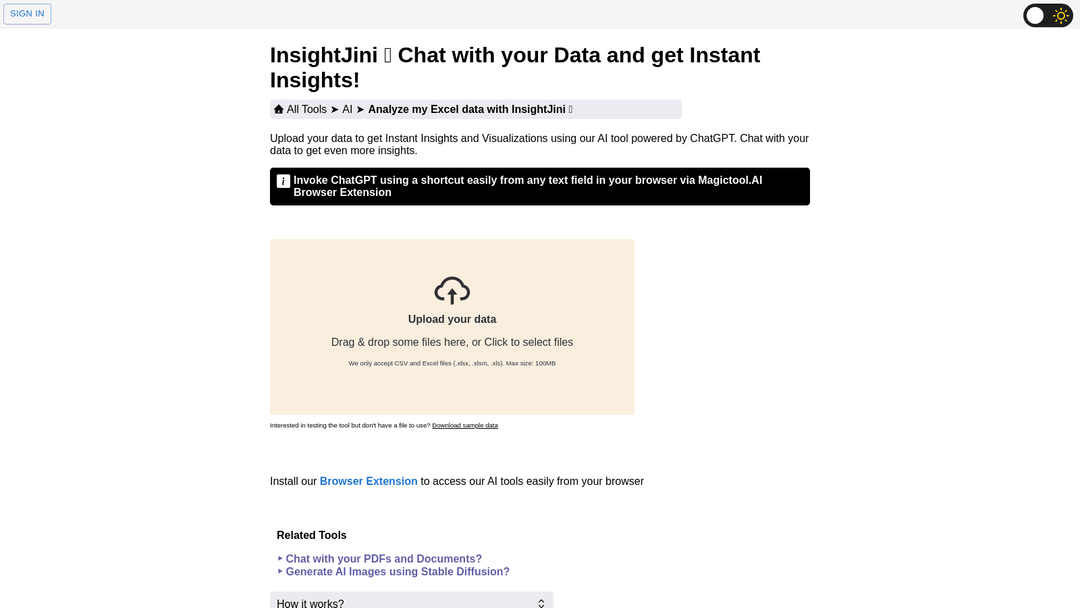
7. InsightJini 2020
Automatic data insights and visualization from Excel/CSV, enhanced with ChatGPT chat.
analytics