
Convert Text into Beautiful Charts with Ease
Discover a powerful tool that effortlessly converts any text content into visually stunning charts and graphs.
| Pricing: | Free, |
| Semrush rank: | 718.0k |
| Location: | Toronto, Canada |
| Tech Used: | Node.js, Radix UI ; Tailwind CSS, React ; Next.js, Next.js, |
Edit this AI
Features
- Simple Conversion Process: Easily transform text data into engaging charts with just a few clicks.
- Customizable Visualizations: Tailor the appearance and style of your charts to suit your preferences or brand identity.
Use Cases:
- Data Analysis and Reporting: Efficiently analyze and present data through visually appealing charts for accurate insights.
- Presentations and Infographics: Create captivating presentations and infographics by converting textual information into eye-catching visualizations.
Unlock the potential of your text content by transforming it into stunning charts effortlessly. Enhance your data analysis, reporting, presentations, and more!


ChartGPT Alternatives:
Free
1
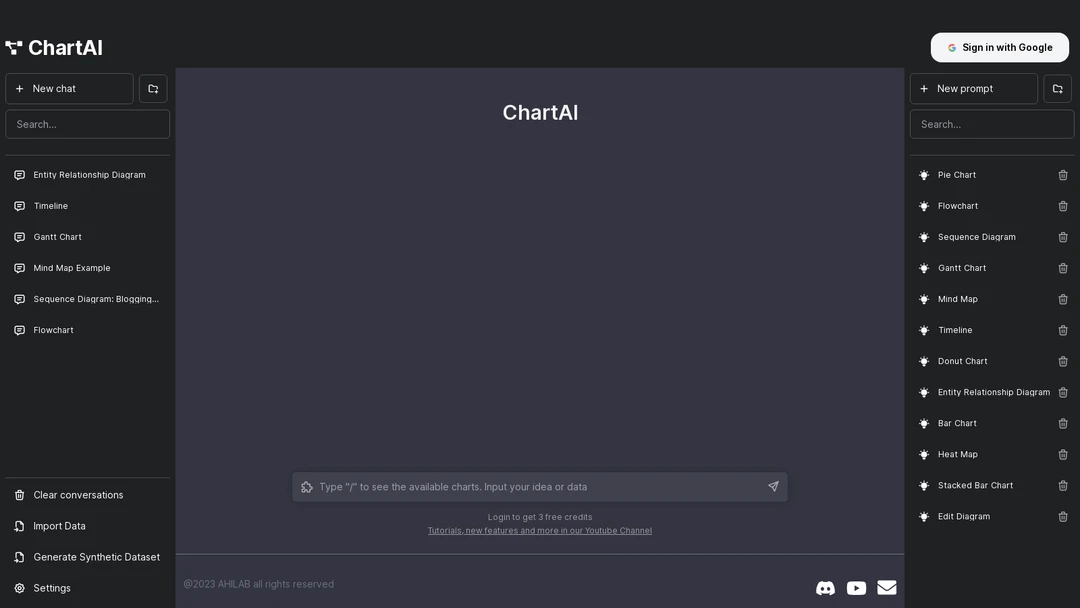
1. Chartai
Streamlines complex chart creation using advanced AI; Google sign-in integration.
visualization
Free
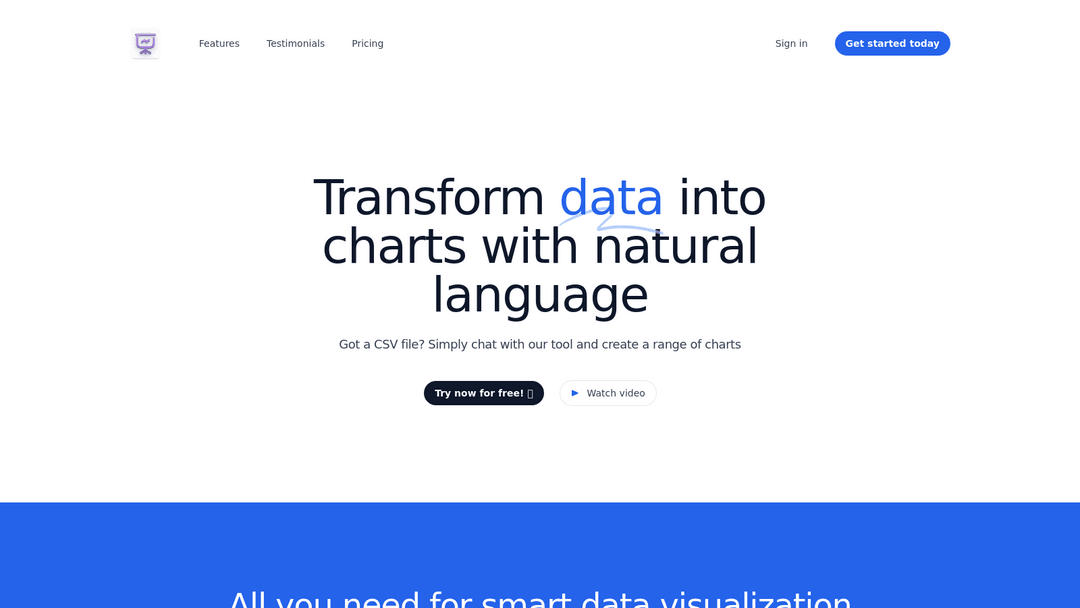
2. Chat2CSV
Chat2CSV visualizes CSV data via natural language into various secure charts.
data visualization
Free
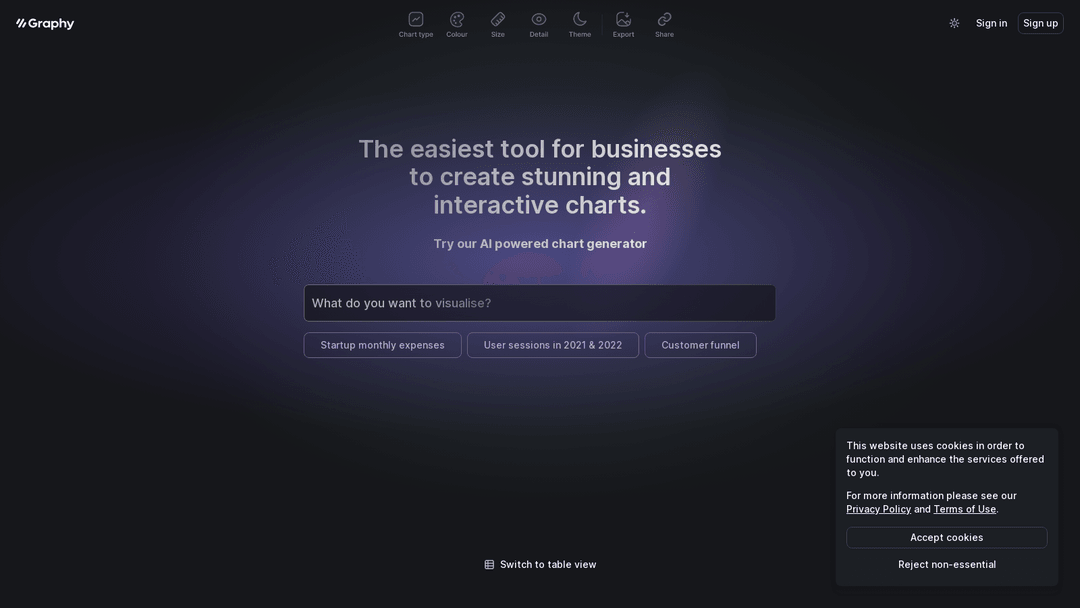
4. Graphy app
Graphy is an AI-powered tool for businesses to create and share interactive charts.
visualization
Free
14
5. Content Generator
AI-driven tool: Generate compelling content and visuals, amplify web impact.
content creation

$5/mo
1
6. Infographic Ninja
Create engaging visuals from text using AI-powered infographic maker.
visualization
Free

Free
10
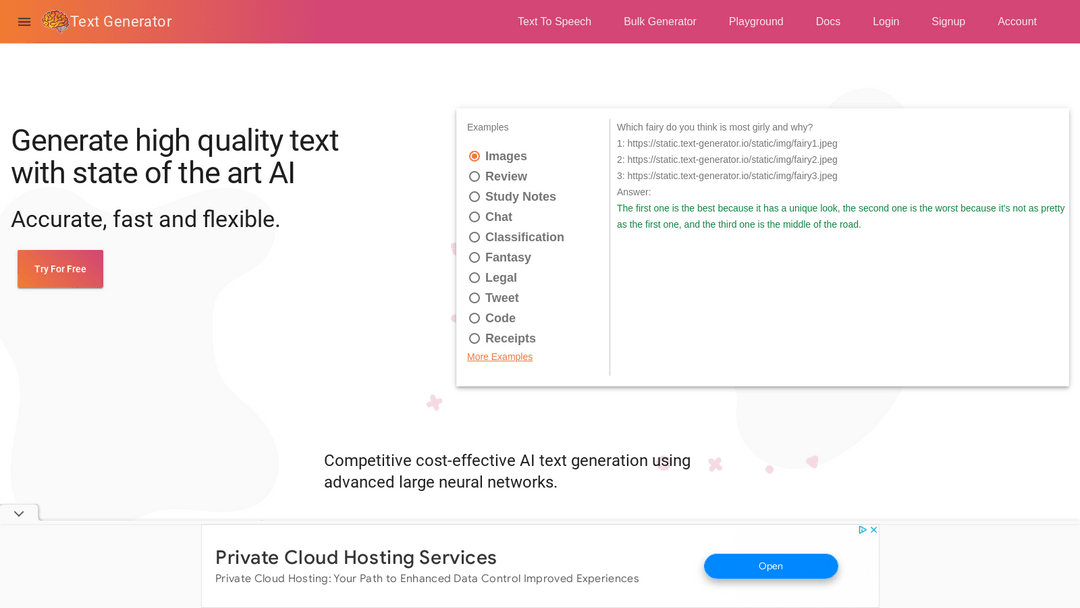
9. Text Generator
AI-powered tool generates quality text efficiently, accurately, and flexibly.
text generation